Weekly Cryptocurrency Market Analysis: Altcoins Are In A Horizontal Trend As Selling Pressure Continues

This week the various cryptocurrencies resumed their sideways trend. eCash, Bitcoin SV, Monero, KuCoin and Maker weekly price analysis from Coinidol.com.
The inability of buyers to break through resistance levels has led to a sideways trend. As a result of the range bound movement, other altcoins have experienced additional selling pressure. Cryptocurrency analyst at Coinidol.com goes over each of these coins briefly.
eCash
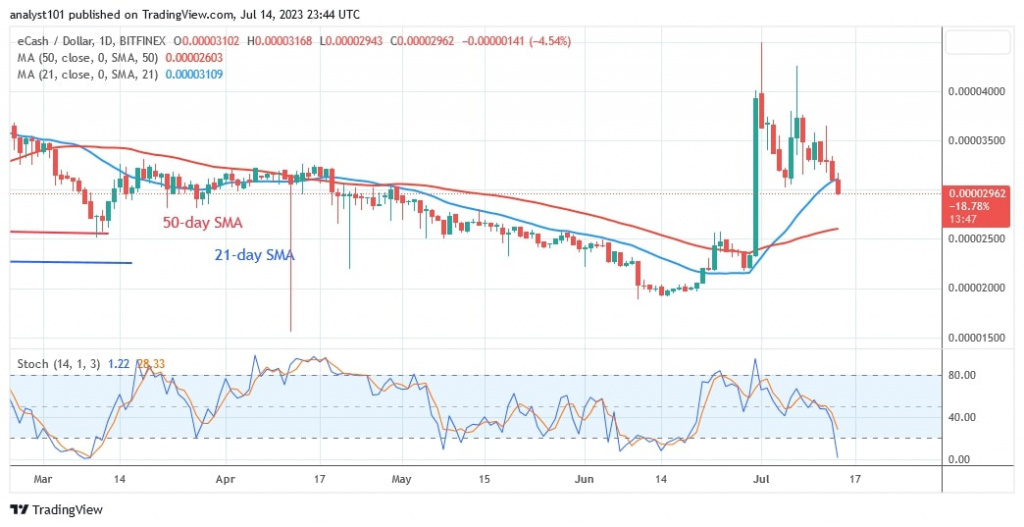
eCash (XEC) Price Moves Sideways. After retesting the previous high of $0.00004, the altcoin is in a fall. The fall is between the moving average lines.
The price of the cryptocurrency has fallen below the 21-day simple moving average. The bearish momentum is expected to extend to the 50-day simple moving average. If the altcoin remains above the 50-day line SMA, it will be forced to trade in a range between $0.000026 and $0.000032. If the bearish momentum falls below the moving average lines, the market will return to the previous low of $0.00002. XEC fell to a low of $0.00002962 today.
The altcoin is in a negative trend below the daily stochastic threshold of 20. The market has reached the oversold zone. Bearish fatigue has been reached for XEC.
XEC is the worst coin and has the following characteristics:
Current price: $0.00003022
Market capitalization: $636.89M
Trading Volume: $40.18M
7-Day Loss: 6.81%
Bitcoin SV
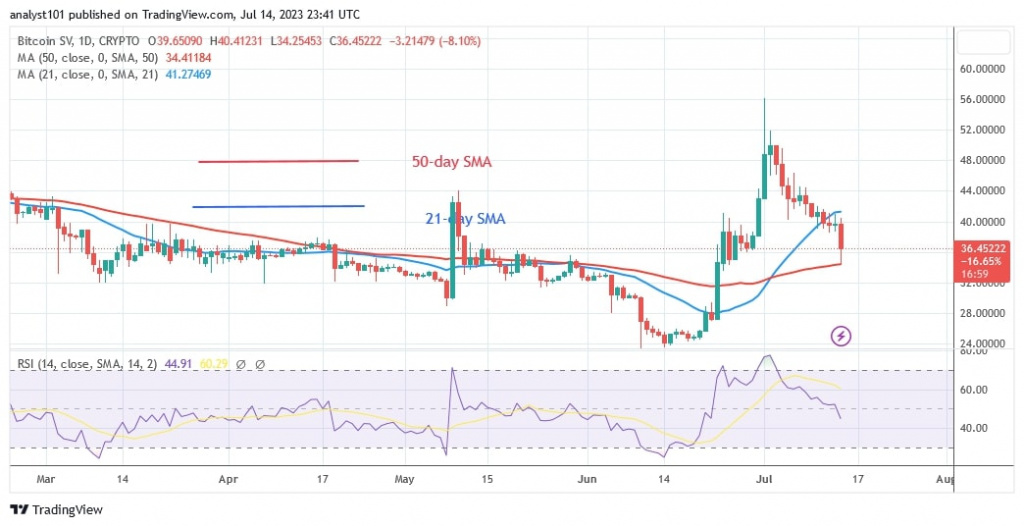
Bitcoin SV (BSV) has fallen between the moving average lines and is in a sideways trend. The decline has ended as it crossed the 50-day line SMA, although it is still below the 21-day line SMA. The cryptocurrency has been caught between the moving average lines. When the moving average lines are broken, it will develop a trend.
BSV is currently trading at $36.07. If the 50-day line SMA is broken, the altcoin will fall to its previous low of $24. The altcoin, on the other hand, will develop positive momentum again if it rises above the 21-day line SMA. BSV will rise to its previous high of $56. For the period 14, BSV is in the negative trend zone with a Relative Strength Index of 43. Below are some details:
Current Price: $36.06
Market Capitalization: $758,240,305
Trading Volume: $54,104,589
7-Day Loss: 6.81%
Monero
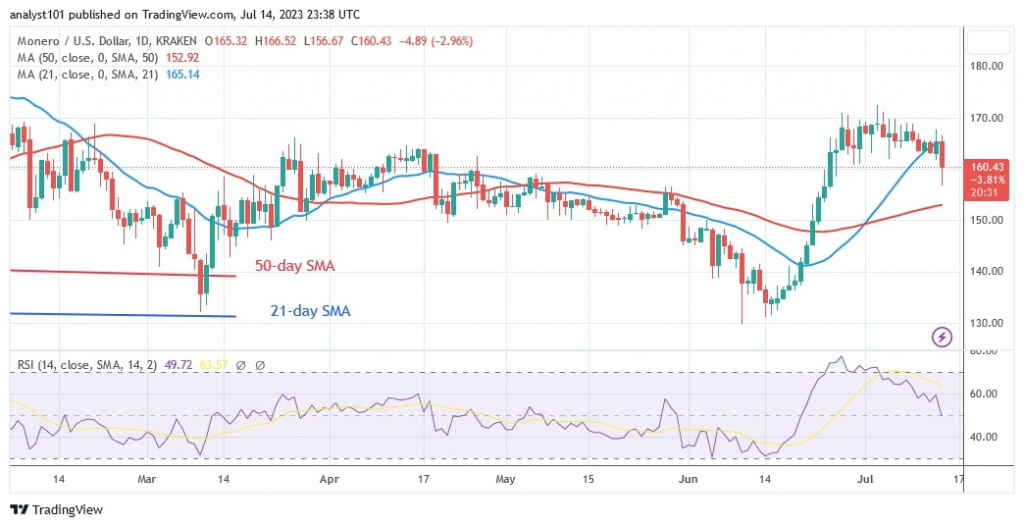
The price of Monero (XMR) is moving sideways. On June 27, the cryptocurrency reached a high of $170 and stayed there. The altcoin has fallen below the 21-day moving average line, but remains above the 50-day line SMA. As it oscillates between the moving average lines, the decline has stopped. At the time of writing, the altcoin was trading at $160.86.
The price of XMR is trapped between the moving average lines. When the moving average lines are broken, the altcoin will trend. On the Relative Strength Index for the period 14, Monero has slipped to the value of 50. As supply and demand balance out, the altcoin's price has reached its equilibrium. Monero ranks third overall. It has the following characteristics:
Current price: $160.87
Market capitalization: $2,919,983,051
Trading volume: $88,373,701
7-day loss: 1.02%
KuCoin Token
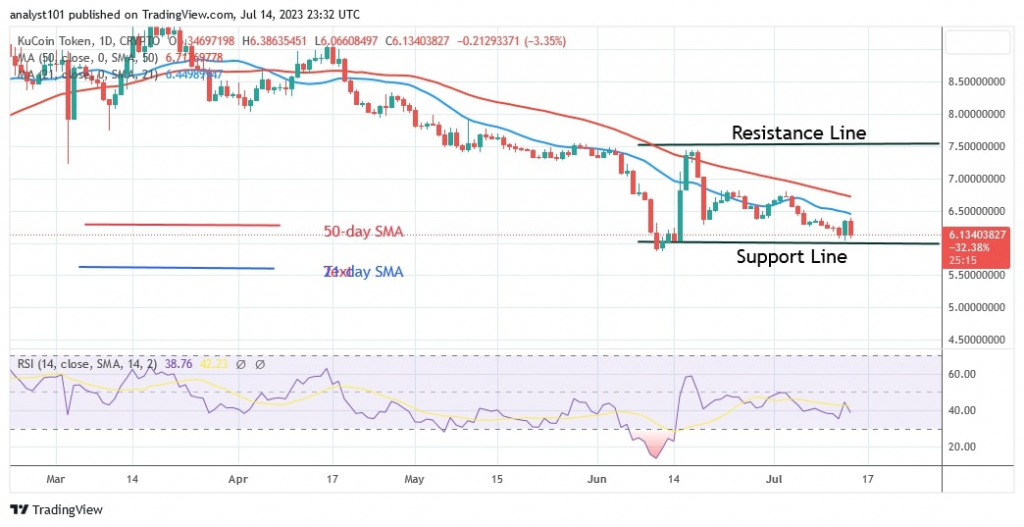
The price of KuCoin Token (KCS) is falling below the moving average lines. The cryptocurrency has dropped dramatically, surpassing its previous low of November 13, 2022. The decline ended on June 11, when the altcoin hit a low of $5.87. Later, the cryptocurrency corrected upwards and broke above the moving average lines. The upward correction was brief as the altcoin was rejected at the $7.50 resistance level.
Over the past month, the altcoin was forced to trade in a narrow range between $6.00 and $7.50. Once the fluctuation range is broken, KCS will develop a trend. At the time of writing, the altcoin is trading at $6.14. The cryptocurrency value is reaching the oversold zone of the market. For the period of 14 months, it is at level 38 on the Relative Strength Index. It is the fourth worst cryptocurrency on the market. It has the following characteristics:
Current price: $6.14
Market capitalization: $1,043,521,680
Trading Volume: $2,424,904
7-Day Loss: 1.01%
Maker
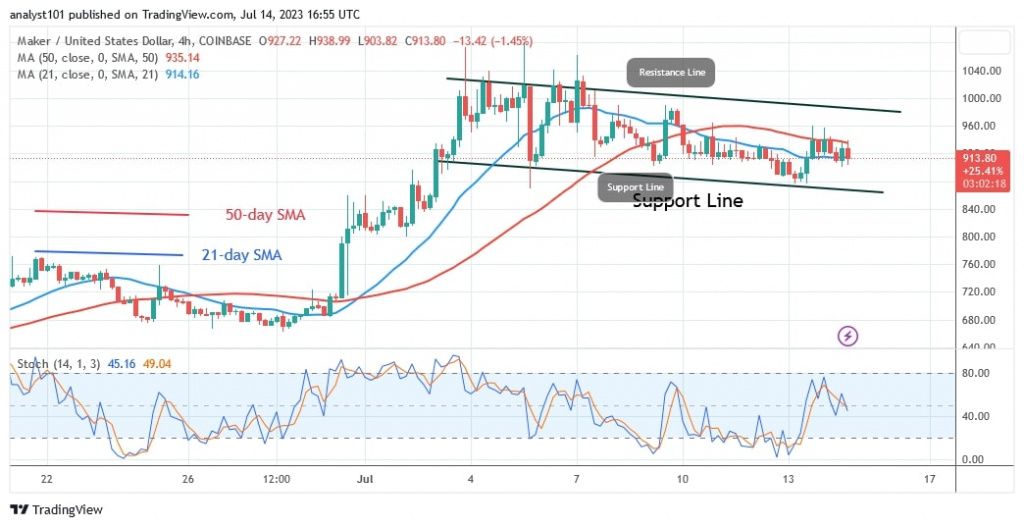
The price of Maker (MKR) is moving sideways. Maker rose to a high of $1,000 in the previous trend, but was pushed back on July 3. Last week, the altcoin traded below the resistance level of $1,000. Today, the cryptocurrency's price fell below the moving average lines. At the time of writing, Maker is trading at $859.57.
The altcoin is in a negative trend below the daily stochastic threshold of 40. It is in the oversold zone of the market. It has the fifth worst performance of all cryptocurrencies. The characteristics are the following:
Current price: $863.03
Market capitalization: $871,123,639
Trading volume: $59,684,305
7-day loss: 0.52%
Disclaimer. This analysis and forecast are the personal opinions of the author and are not a recommendation to buy or sell cryptocurrency and should not be viewed as an endorsement by CoinIdol.com. Readers should do their own research before investing in funds.
News
Coin expert
Politics
Price
Price

(0 comments)