Using Fibonacci in Trading is Simpler than it Seems

Fibonacci ratios are obtained after dividing or splitting the numerals. For instance, if we divide 34 by 55, we shall get 0.61818182, and when this figure is converted into the percentage form, it simply becomes 61.818 percents, note that a figure like this is often rounded to 62 %. The finance sector normally uses these ratios, since the price trends of assets are not always linear.
During the times of bullish movement, the market sees a series of corrections or brief phase of consolidation, but when there is a bearish pattern, numerous recoveries or rebounds will be registered.
Fibonacci and the Fans
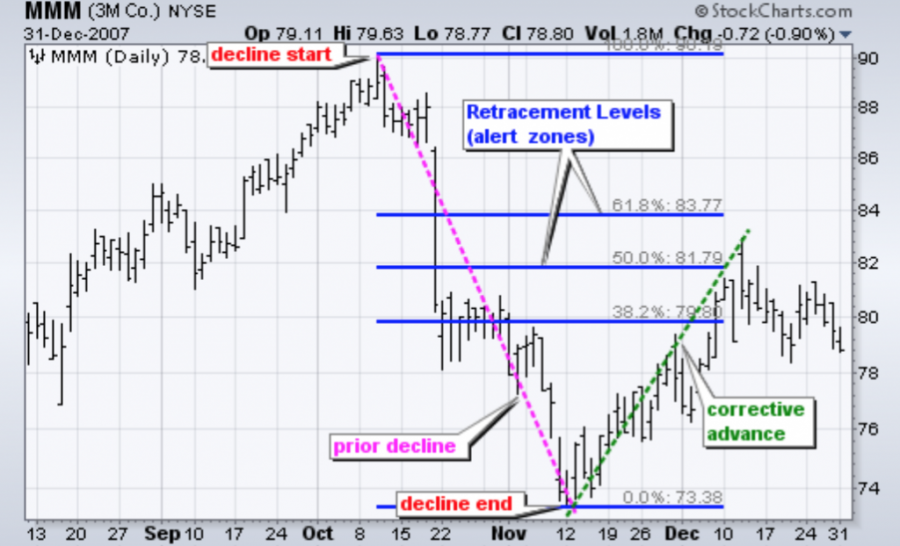
To ascertain the support levels as well as the resistance levels, the finance sector can use retracements. These are ratios which are deployed to identify and ascertain potential reversal levels and are usually in the vicinity of the sequence. These are normally hinged on a line produced (sketched) between a correlative extreme and bottom.
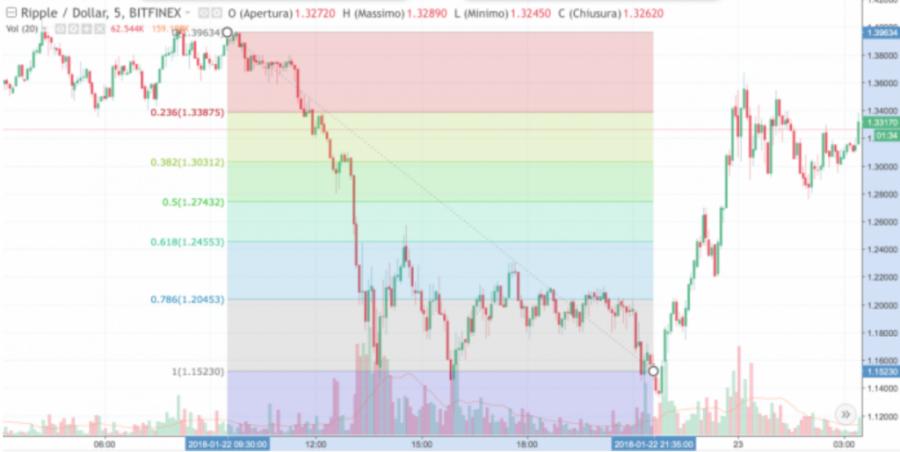
After a bearish or buoyant movement, Fibonacci rates can be easily traced or reproduced back to correlations obtained from the series: 24, 38, 50, 62 and 76 percent. A bullish trend is normally followed by a relationship which later ends after moving in the opposite course, shown by one of the major retracement percent.
Traders normally uses the Fibonacci fans to forecast major resistance and support points, upon which they might anticipate price patterns to reverse. These are usually hinged on the percent retracements of the pattern, 38%, 50% and 62% correspondingly, which are over and under the line connecting a comparative recorded bottom and a successive comparative historical high, or contrariwise. This indicator can also be applied for timing in future markets.
Source text: https://it.coinidol.com/usare-fibonacci-trading/