Ripple Coin Breaks Through The Initial Barrier And Targets The High At $0.57

The coin price of Ripple (XRP) rises on the breakout above the 21-day SMA.
Long-term analysis of Ripple: bearish
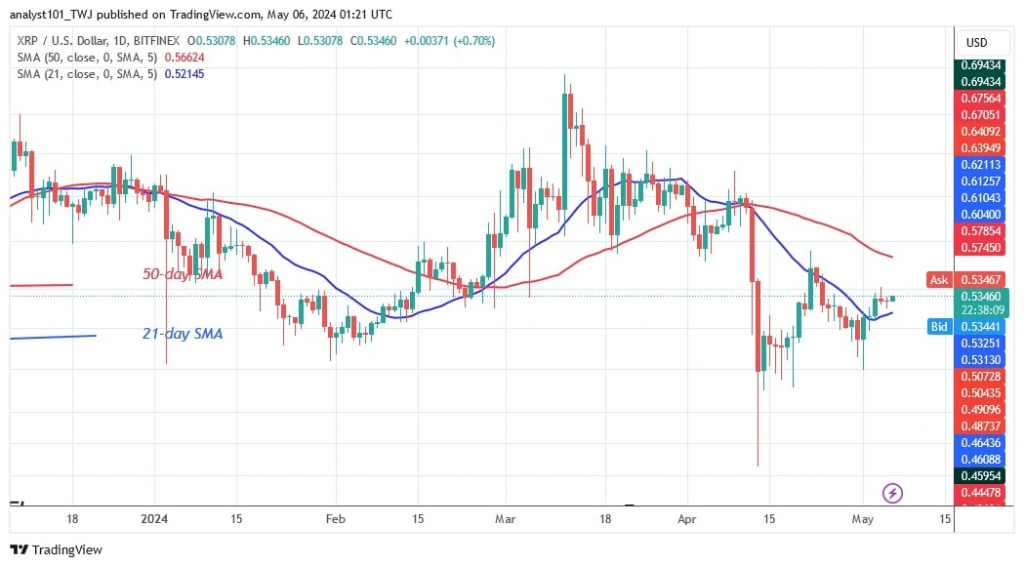
In the previous price action, the cryptocurrency moved between the $0.46 support and below the moving average lines. The bulls have gained the upper hand as buyers have broken through the 21-day SMA. The bullish momentum is expected to reach the high of the 50-day SMA, which is at $0.57.
Similarly, XRP will resume its uptrend if it breaks above the 50-day SMA. A breakout will take the altcoin back to its previous high of $0.74. The price of the altcoin is currently trading at $0.53. The altcoin is trading above the 21-day SMA and below the 50-day SMA. If the price falls below the 21-day SMA, XRP will lose value.
Analysis of the Ripple price indicator
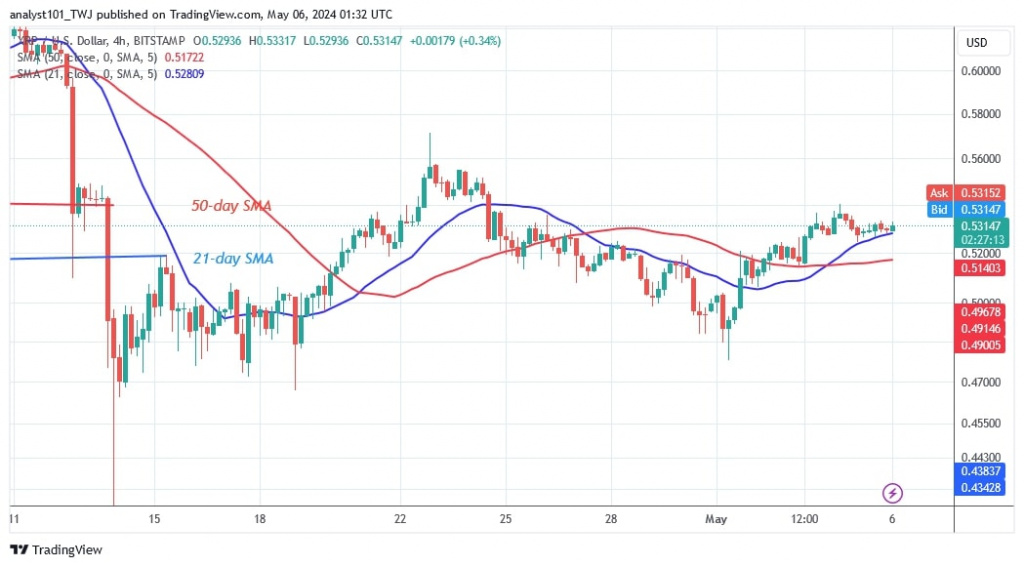
The altcoin is expected to rise as its price bars are above the moving average lines on the 4-hour chart. Also, the price bars on the daily chart have moved between the moving average lines. The cryptocurrency will try to fluctuate between the moving average lines.
Technical indicators:
Key resistance levels – $0.80 and $1.00
Key support levels – $0.40 and $0.20

What is the next direction for XRP?
XRP has resumed its bullish momentum with the price breaking through the 21-day SMA resistance line. On the 4-hour chart, the uptrend was halted at the high of $0.54. The price of the cryptocurrency has retraced and remains above the 21-day SMA. The Doji candlestick has appeared as the price movement is limited.

Disclaimer. This analysis and forecast are the personal opinions of the author and are not a recommendation to buy or sell cryptocurrency and should not be viewed as an endorsement by CoinIdol.com. Readers should do their research before investing in funds.
Price
Price
Price
Price
Price

(0 comments)